
Producing another variation can be quick. Learning whether it improves a business outcome can take much longer. The constraint is often the number of comparable participants who can complete the outcome window, not the number of ads a team can generate.
Before commissioning a large batch, use the A/B sample-size planner to connect the hypothesis to a feasible experiment. Then save the assumptions in the creative testing template.
Begin with the decision, not the number of variations
Write what you will do differently if the treatment works. Perhaps you will replace the landing-page explanation, adopt a new demonstration format or change the first step of an inquiry flow. The decision should be specific enough that a result could support it or leave it unresolved.
Next, describe the mechanism. “Version B has a new headline” describes an asset. “Version B explains the appointment process earlier, reducing uncertainty for qualified visitors” describes a reason behavior might change.
That mechanism helps choose the outcome. If the goal is more useful inquiries, a click-through-rate increase alone does not answer the question. Track the accepted inquiry and define a quality guardrail so the test does not reward a promise that attracts the wrong prospects.
Separate relative lift from percentage points
At a 5% baseline conversion rate, a move to 6% is:
- An absolute increase of 1 percentage point.
- A relative increase of 20%, because
(6 − 5) ÷ 5 = 0.20.
A “5% improvement” is ambiguous unless the team specifies which meaning it intends. A 5% relative increase from a 5% baseline targets 5.25%; an increase of 5 percentage points targets 10%. Those are very different hypotheses with very different sample requirements.
The planner asks for a relative minimum detectable increase and shows the corresponding target rate and absolute change. Write all three in the test brief. That makes the commercial assumption visible before someone interprets the output as a budget recommendation.
Use a baseline from the intended experiment
Choose a mature baseline for the same population, outcome definition and observation window. A whole-site average can be a poor planning input for a test limited to new paid visitors in one market.
Check whether the baseline period includes a sale, outage, tracking change or unusual traffic source. You do not need to remove every unusual day mechanically; you need to understand whether the input describes the experiment you intend to run.
For a lead-generation test, decide whether conversion means a browser event, server-accepted form, qualified inquiry or completed sale. The deeper outcome may be closer to business value but arrive more slowly and less frequently. Use the lead quality scorecard to keep those stages distinct.
Work through the sample requirement
Consider this illustrative design:
| Planning input | Value |
|---|---|
| Baseline binary conversion rate | 5% |
| Target conversion rate | 6% |
| Relative increase to detect | 20% |
| Confidence setting | 95%, two-sided |
| Statistical power | 80% |
| Allocation | Two groups, 50/50 |
| Total unique eligible participants per day | 1,000 |
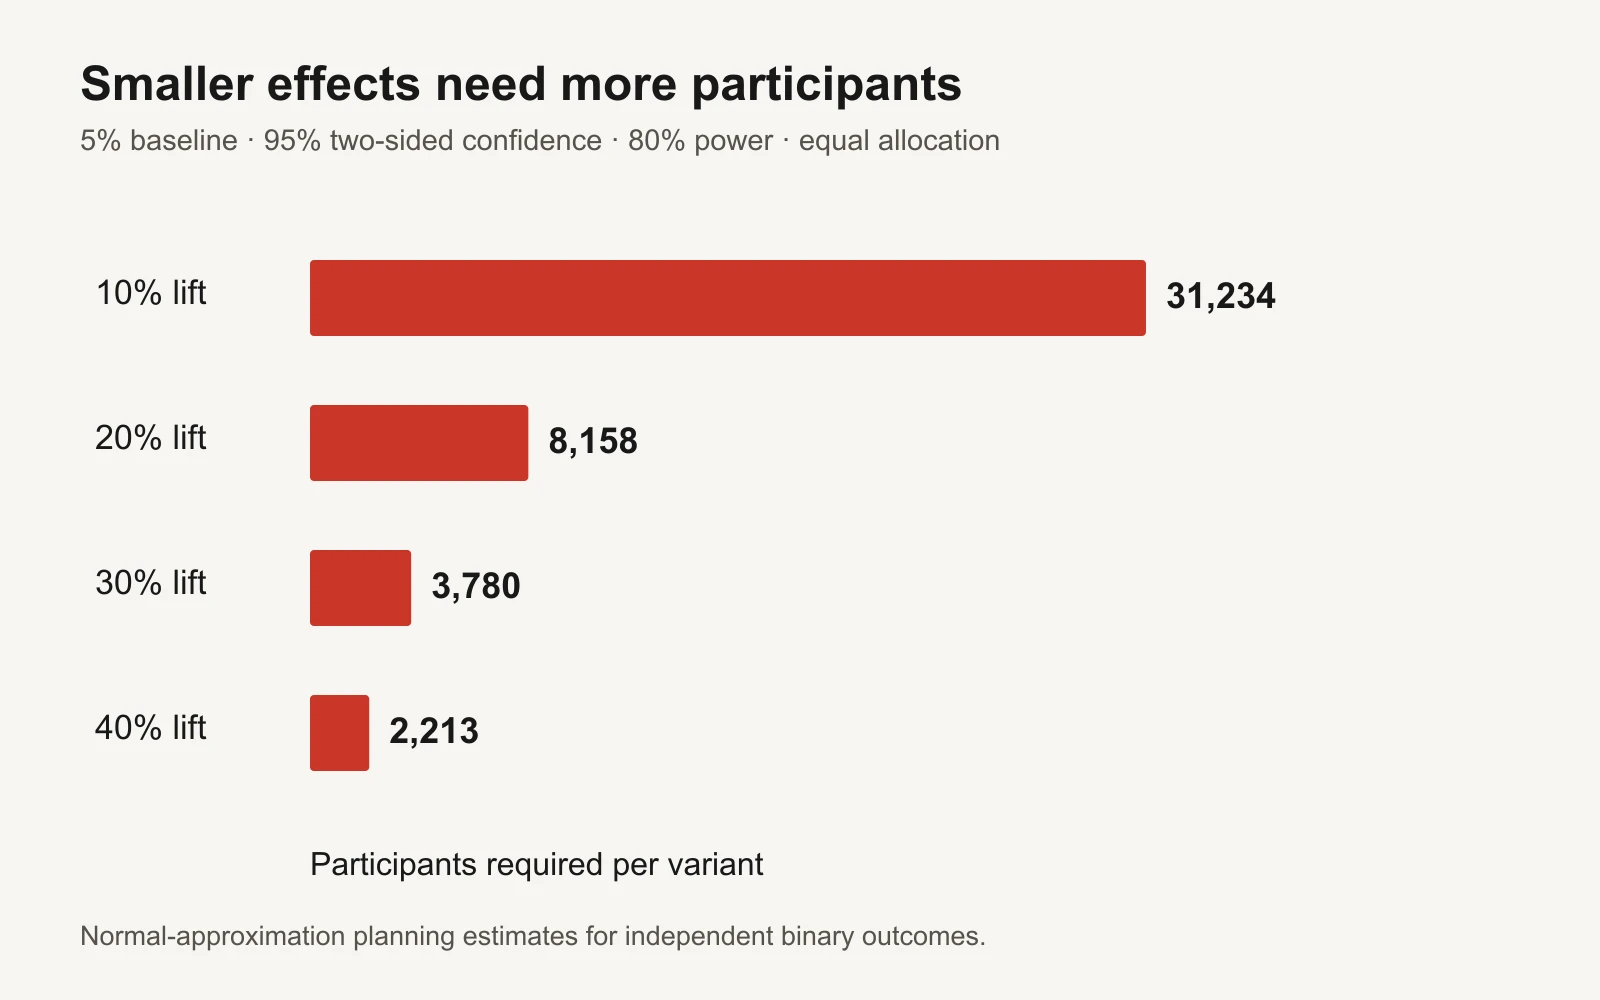
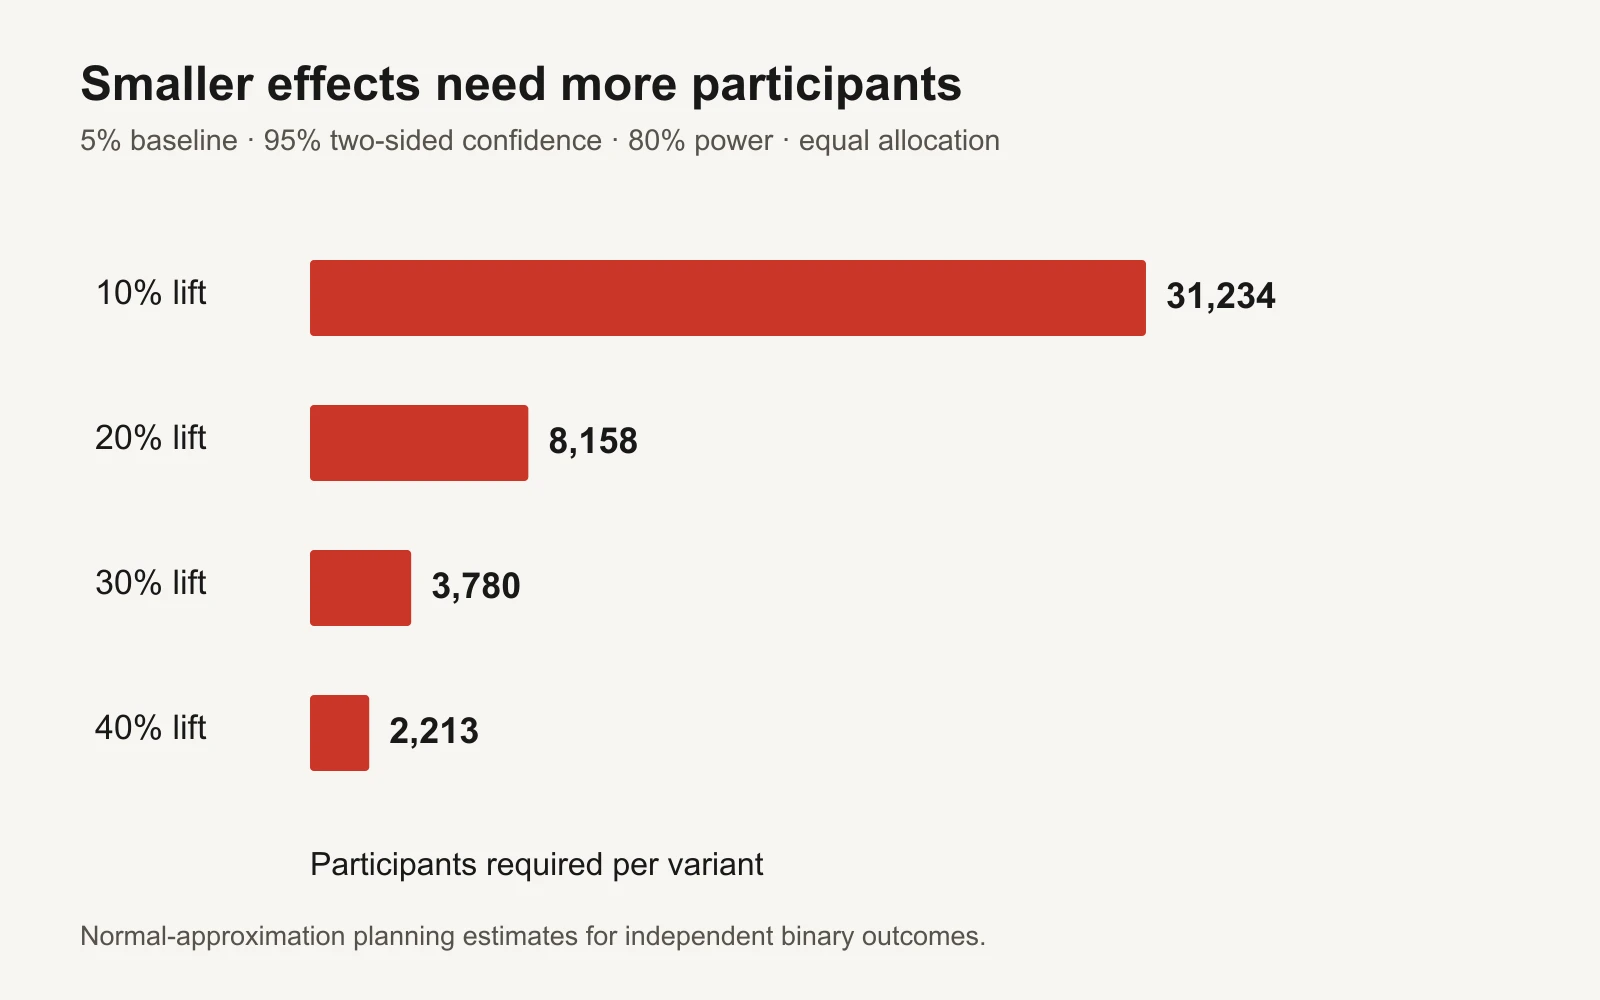
The normal approximation used by our planner gives 8,158 participants per group, or 16,316 total. At the stated recruitment rate, sample collection takes at least 17 days.
The method combines pooled variance under the null with separate outcome variance under the alternative and rounds the required per-group count up. The two-sided calculation omits a usually negligible far tail. The statsmodels method documentation describes that approximation. Small expected outcome counts and other designs require a more suitable method.
This is a planning estimate, not a promise that the experiment will produce a significant result. The actual effect may be smaller, zero or negative. The assumptions may also be wrong.
Interpret power correctly
Power describes the chance of detecting the specified effect when the planning assumptions hold. It is not the probability that a particular winning variation is truly better.
Higher power and stricter confidence generally require more participants for the same effect. A smaller minimum detectable effect can increase the requirement substantially. These tradeoffs are why a sample calculator should be used before the test starts, while the design can still change.
Do not lower the confidence setting after looking at disappointing results. That changes the decision rule in response to the evidence you hoped to judge. If the business must make a decision under uncertainty, state that limitation directly rather than relabeling the evidence as stronger than it is.
Convert participants into a realistic operating plan
The planner's time estimate uses unique eligible participants across both groups. It does not use pageviews, repeated clicks or buyers alone. A returning person should not become several independent experimental units simply because they visited several times.
If you need a budget scenario, connect the recruitment rate to a separately justified cost assumption. For example, suppose 16,316 eligible participants must be recruited, a paid click costs an illustrative $2, and 80% of those clicks become eligible unique participants. The scenario requires approximately 16,316 ÷ 0.80 = 20,395 clicks, or $40,790 at the assumed CPC.
That is arithmetic under assumptions, not a forecast. CPC can change, eligibility may differ between sources, and repeat clicks can reduce the number of new participants. Keep the cost assumption in the plan and review it before spending. The CPC calculator can help reconcile the observed cost definition.
If the proposed experiment costs more than the decision could reasonably justify, change the design or the decision scope. Do not hide that mismatch by pretending impressions are interchangeable with participants.
Add conversion maturity and calendar coverage
Recruitment completion is not outcome completion. The final participants need time to convert within the agreed window. Offline qualification or sales outcomes can take longer still.
Weekly patterns may matter too. A sample collected during a short promotional spike may not represent the operating period in which the treatment will be used. Record the planned recruitment horizon, observation window and analysis date separately.
For example, an experiment can finish recruiting on a Friday while the last inquiry cohort remains unreviewed. Declaring a winner immediately would compare mature early participants with incomplete late participants. Preserve the window instead of letting the launch calendar dictate the statistical interpretation.
Do not confuse ad rotation with random assignment
Two ads in the same ad set can receive different delivery because a platform is selecting where and to whom to serve them. Their reported conversion rates may reflect audience selection and delivery policy as well as creative differences.
A randomized experiment needs a documented assignment mechanism appropriate to the question. A landing-page test might assign eligible participants persistently. A platform experiment has its own design and limitations. A geographic experiment uses a different unit and generally needs a different analysis from the simple two-proportion planner.
When you only have an observational delivery comparison, it can still help choose the next operational step. Label it honestly. Avoid claiming a causal lift that the design did not estimate. The attribution and incrementality guide explains why that distinction matters for budget decisions.
Reduce the number of questions in low-volume accounts
Twenty ideas can be a useful creative backlog. They do not need to become twenty simultaneous experimental arms.
Group the ideas by mechanism, remove unsupported claims and production defects, and choose a material contrast. Keep the remaining ideas for later tests. This lets production explore broadly while measurement concentrates on a question the account can support.
For a very low-volume outcome, a formal test may remain impractical. Options include gathering more comparable traffic, extending the horizon when conditions can stay stable, or making a bounded operational choice while acknowledging uncertainty. Changing the outcome to an easier proxy is only useful if the proxy informs the decision; a cheap click is not automatically a valuable customer.
Predefine how the test ends
The brief should include the primary outcome, planned sample, observation window and stopping rule. Define how you will handle a tracking failure, severe operational issue or assignment problem before one occurs.
A fixed-horizon design should not end simply because a dashboard briefly looks favorable. Repeated peeking and optional stopping require a method designed for that process. The simple planner does not supply one, and it does not adjust for many outcomes or comparisons.
At the planned review, save the effect estimate, uncertainty, exclusions and quality checks. “Inconclusive” can be a valid result. The useful deliverable is a decision whose confidence matches the evidence, plus a clear next question when the current test cannot settle it.