
A useful PPC forecast explains what has to be true for a budget to make sense. It connects the amount you plan to spend with the customers you expect to acquire and the contribution those customers could produce. When the assumptions change, the result should change visibly.
Start with the free PPC budget forecast template. It includes an Excel workbook with formulas and a separate CSV register for the origin of each assumption. The numbers in the workbook and this article are fictional examples. They are not account results, industry benchmarks or a recommended budget.
Define the outcome before entering a conversion rate
“Conversion rate” can describe several different steps. A landing-page form submission rate is different from the share of accepted inquiries that sales qualifies. Neither is the share of qualified opportunities that become customers.
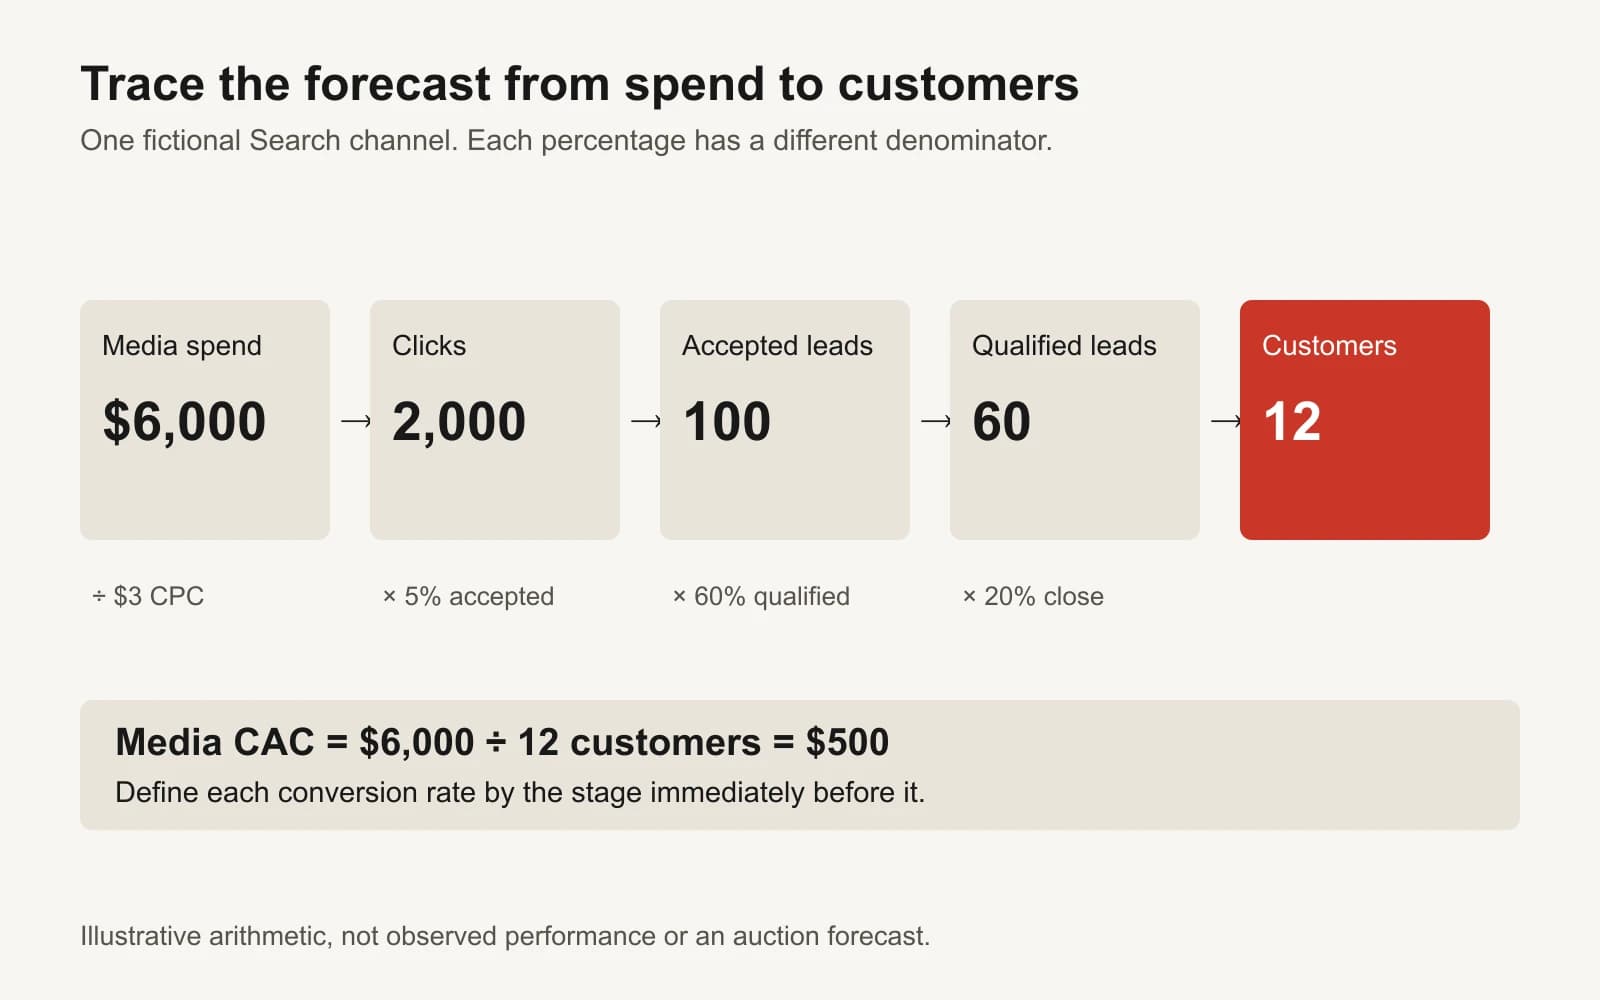
Our example uses this chain:
- Media spend buys clicks at an assumed cost per click.
- A share of clicks produces accepted inquiries.
- A share of accepted inquiries meets the business's qualification definition.
- A share of qualified leads becomes new customers.
- Each new customer contributes an assumed amount before advertising cost.
Write those denominators beside the inputs. If the qualification rate already means customers divided by accepted leads, multiplying it by another close rate would count a stage twice. The formula can be technically correct while the business definition is wrong.
Use the lead quality scorecard to agree on the stages. Keep pending reviews separate from rejected leads. A campaign with a large sales-review backlog should not inherit a low qualification assumption merely because its outcomes are incomplete.
Use a compatible reporting basis
Choose one currency, period and outcome horizon. If one channel uses media cost excluding fees and another includes agency retainers, their acquisition costs answer different questions. Label the metric and reconcile the cost scope before comparing them.
Use mature cohorts when estimating qualification and close rates. A cohort of inquiries generated last week may have had little time to become customers. Applying its incomplete close rate to a future month can make a healthy channel look uneconomic. The reverse problem occurs when the numerator includes old customers while the denominator contains only recent leads.
Contribution per customer also needs a definition. In this workbook it means revenue less the variable costs you include, before media cost. Record fulfillment, payment fees, refunds and other relevant costs in your own assumptions register. Fixed overhead is excluded unless you deliberately include it in a separate model. Contribution after media is therefore not net profit.
Use the same customer horizon across channels. Comparing first-order contribution in Search with an optimistic lifetime estimate in paid social is not a fair allocation exercise. If retention is uncertain, show that uncertainty in a separate, explicit estimate rather than hiding it inside a single attractive number.
Work through one channel
The fictional Search plan has these assumptions:
| Input | Value |
|---|---|
| Planned media spend | $6,000 |
| CPC | $3.00 |
| Click to accepted-inquiry rate | 5% |
| Accepted-inquiry qualification rate | 60% |
| Qualified-lead customer close rate | 20% |
| Contribution per new customer before media | $1,000 |
The arithmetic is transparent:
| Calculation | Result |
|---|---|
| Clicks = $6,000 / $3 | 2,000 |
| Accepted inquiries = 2,000 × 5% | 100 |
| Qualified leads = 100 × 60% | 60 |
| New customers = 60 × 20% | 12 |
| Media CAC = $6,000 / 12 | $500 |
| Contribution before media = 12 × $1,000 | $12,000 |
| Contribution after media = $12,000 − $6,000 | $6,000 |
Each line gives the reviewer a place to challenge the model. Is $3 CPC compatible with the intended audience and spend? Does the 5% rate describe accepted inquiries rather than clicks on the form button? Does the close rate come from a mature cohort with comparable qualification rules?
A forecast is useful when those questions are easy to answer. More decimal places do not compensate for unclear definitions.
Calculate combined efficiency from matching totals
The workbook adds two more fictional channels:
| Channel | Spend | Expected customers | Media CAC | Contribution after media |
|---|---|---|---|---|
| Search | $6,000 | 12 | $500 | $6,000 |
| Paid social | $3,000 | 5 | $600 | $2,000 |
| Other paid | $1,000 | 2 | $500 | $1,000 |
| Combined | $10,000 | 19 | $526.32 | $9,000 |
Combined media CAC is $10,000 divided by 19 expected customers. It is not the simple average of $500, $600 and $500. That average would give each channel equal weight despite different spend and customer counts.
The same principle applies to conversion rates. Add compatible numerators and denominators, then calculate the combined ratio. Do not average campaign percentages unless the weighting matches the question. The workbook exposes the channel calculations and combines the finished totals so a reviewer can trace the result.
Fractional expected counts are valid in a forecast. A channel can imply 2.4 expected customers even though a real outcome is a whole person. Preserve that expectation in the calculation and use sensible display precision. Rounding every intermediate stage to an integer can distort a small plan.
Test the assumptions that could break the decision
Start by changing one driver that has a plausible reason to move. In the Search example, reducing the qualified-lead close rate from 20% to 10% produces six expected customers. Media CAC becomes $1,000 and contribution after media falls to zero.
That change does not prove the original forecast was bad. It identifies a commercial dependency: the plan needs enough qualified leads to close at the assumed contribution. Sales capacity, offer fit and follow-up execution may matter as much as the click cost.
Next, test a plausible combination. If CPC rises from $3 to $4 and the qualification rate falls from 60% to 40%, the same $6,000 buys 1,500 clicks, producing 75 accepted inquiries, 30 qualified leads and six expected customers at a 20% close rate. Again, contribution after media is zero. Those two driver changes have a different operational explanation from a lower sales close rate.
Record why you selected each changed assumption. “Downside” is only a label until the underlying driver values have a rationale. Save a dated copy of the original plan before experimenting so a later reviewer can distinguish the approved planning basis from an exploratory edit.
The spend scenario guide explains how to connect alternatives with operating decisions. The capacity-based budgeting guide helps check whether the business can handle the volume the worksheet implies.
Keep arithmetic forecasts separate from auction forecasts
This workbook applies the rates you enter. It does not estimate how auctions, audience saturation or competitor behavior will change at a different spend level. Doubling spend while leaving every rate unchanged mechanically doubles expected outcomes; that is a consequence of the assumptions, not evidence that the channel can scale that way.
Google's Performance Planner uses provider auction information and campaign data to generate its forecasts. Its current documentation explains supported campaign types, eligibility and conversion-goal selection. Review the applicable provider model alongside your business assumptions rather than treating this spreadsheet as a replacement. Google Ads Performance Planner.
Attribution creates another boundary. Customers attributed to different channels can overlap or reflect existing demand. A combined planning table does not establish incremental customers caused by advertising. If the decision requires a causal estimate, use an appropriate experiment and keep its uncertainty visible. The incrementality guide explains why attributed efficiency and causal lift answer different questions.
Use missing and zero values honestly
The workbook displays n.a. when a required input is missing or invalid. Positive spend with zero CPC is undefined. Zero expected customers means media CAC is unavailable, while contribution after media still shows the spend that was incurred.
For an inactive channel, enter zero spend and valid rate and contribution inputs. A zero CPC is allowed when spend is also zero. Do not leave a channel half-filled and assume that a combined total containing only the completed columns describes the full plan.
When editing the workbook, preserve formula cells and replace the amber inputs. Enter a five-percent rate as 5%, not 5. The downloadable assumption register gives you a place to document the source, reporting period and owner for each driver. The register is a CSV without formulas; the Excel file contains the calculations.
Turn the forecast into an operating review
A forecast becomes useful when it helps choose the next action. If the plan requires more qualified leads than the sales team can review, resolve capacity before increasing spend. If contribution is highly sensitive to refunds, improve the estimate before presenting a precise acquisition target. If a key rate has no usable source, label it as an assumption and decide what evidence would reduce the uncertainty.
Once a budget is approved, use a budget pacing sheet and the pacing calculator to compare actual spend with the period allowance. Forecasting asks what the plan could produce. Pacing asks how spending is progressing against the approved plan. Keep both connected to the same scope, while preserving their different purposes.
Bring the original assumptions, actual compatible outcomes and the proposed next change into the review. A missed forecast should lead to an explanation of which driver differed, not an automatic increase or cut. The workbook supplies the arithmetic; the operating decision needs the evidence behind it.